What Is an Audiogram?
An audiogram is a chart used to record how well someone hears different sounds. It maps the quietest tones a person can detect across a range of pitches (frequencies). The higher the marks appear on the graph, the softer the sound that was heard. When plotted, the results reveal whether hearing is within normal limits or shows signs of loss, and to what degree.
How an Audiogram Works
During a hearing test, tones are played through headphones or a small bone vibrator. The listener signals when they hear each sound, and the audiologist records the responses. Two pathways are tested
- Air conduction:- Measures how sound travels through the outer, middle, and inner ear using earphones.
- Bone conduction:- Sends vibrations directly to the inner ear via the mastoid bone, bypassing the outer and middle ear.
The graph is organized with:
- Frequency (pitch) along the horizontal axis, measured in Hertz (Hz), from low notes (like a drum) to high notes (like a whistle).
- Intensity (loudness) along the vertical axis, measured in decibels (dB), from very soft to very loud sounds.
What the Audiogram Reveals
- Type of hearing loss:- Conductive (outer/middle ear), sensorineural (inner ear), or mixed
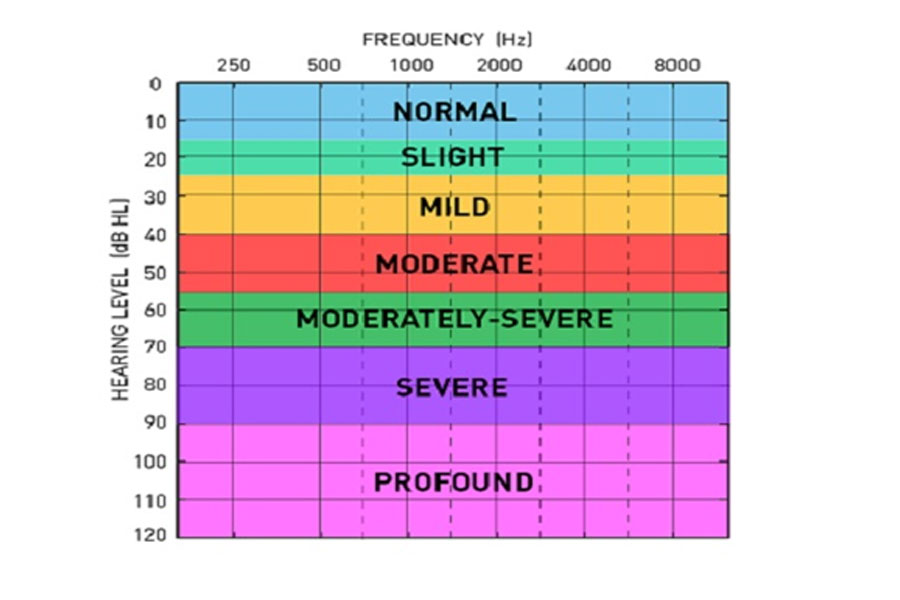
- Degree of loss:- Ranges from mild to profound depending on how loud sounds must be to be heard.
- Configuration:- Shows whether hearing loss affects low, high, or all pitches.
Why It Matters
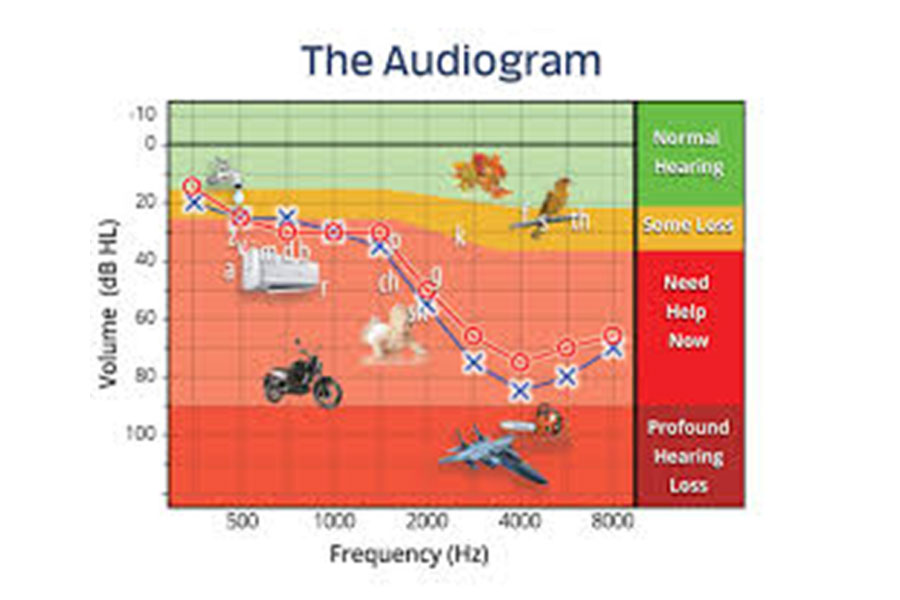
Audiograms help audiologists determine how much amplification is needed for hearing aids, track changes in hearing over time, and identify the likely source of the problem. They also highlight which speech sounds may be difficult to hear — for example, high-pitched consonants like “s” versus lower-pitched vowels like “o.”
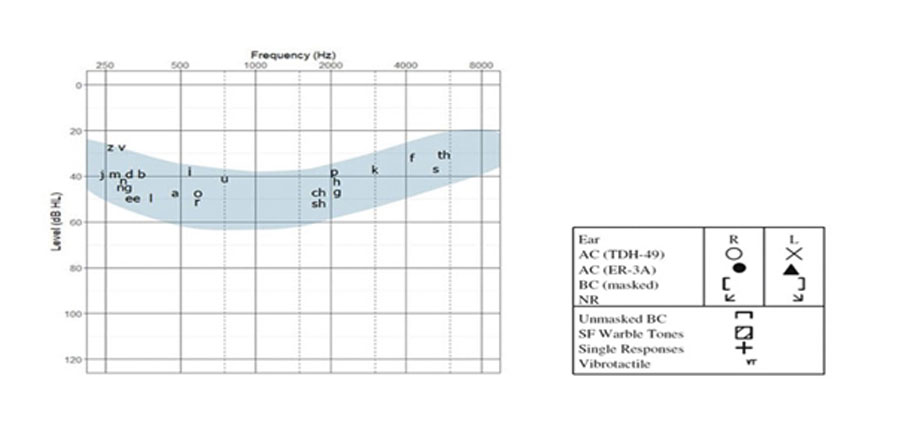
Reading Audiogram Symbols
Results are marked with symbols:
- A red O for the right ear.
- A blue X for the left ear
Marks near the top of the chart indicate normal hearing; marks lower down show hearing loss. Many audiograms also include a shaded “speech banana,” representing the range of sounds used in everyday conversation.
Audiograms for Children
Children’s hearing tests often use play-based methods to keep them engaged. Normal thresholds are slightly stricter for kids (around 0–15 dB) compared to adults (0–20 or 25 dB). Pediatric audiograms may look similar to adult charts but are interpreted differently.
Examples:
- Normal hearing: All responses fall within the expected range.
- Mild loss: Difficulty hearing soft speech or speech in noisy environments.
- Moderate loss: Trouble hearing regular conversation, even nearby.
- Severe loss: Only very loud sounds, such as sirens, are detected.
Measuring Hearing
If air conduction testing shows reduced hearing, bone conduction testing helps pinpoint whether the issue lies in the outer/middle ear or the inner ear.
- Better bone conduction than air conduction suggests conductive loss.
- Equal results for both indicate sensorineural loss
Why Audiogram
Audiogram shows how loud sounds need to be at different frequencies for you to hear them. Audiogram diagnoses hearing loss and shows type, degree, and configuration of hearing loss and pinpoints the cause. Audiogram helps fit hearing aids as well as monitor changes in hearing over time.
If you hear a sound during a hearing test, you raise your hand or push a button. The audiologist makes a note of how loud the sound was at each frequency. At the end audiogram shows what you heard.
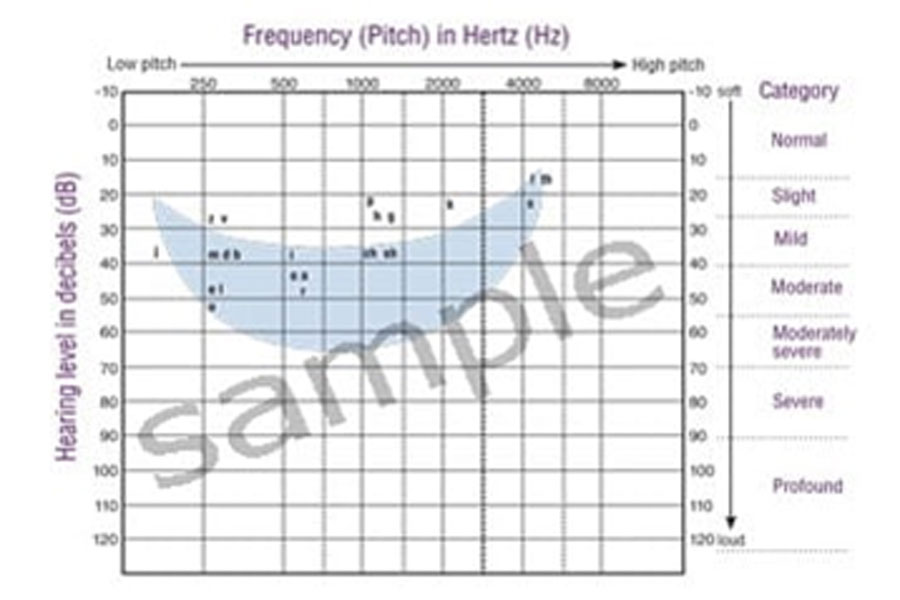
Audiogram Pitch or Frequency
In audiogram each line that runs from left to right shows a frequency in Hertz, or Hz. The lowest pitches are on the left side and the highest pitches are on the right side from 125 Hz to 8000 Hz. Lines at the top represent soft sounds, while lines at the bottom represent loud sounds.
The audiogram shows pattern and severity of hearing loss. Your hearing might be normal for low pitches but not for high pitches. In this case, you might hear speech, but it won’t sound clear. If you have hearing loss at all pitches, you may have problems hearing any speech. The audiogram below has a shaded area that shows range of pitch and loudness for most speech sounds.
Audiogram Examples
Note that audiograms are not exactly the same for kids and adults, as they differ in interpretation, normal hearing thresholds, and testing methods. While graph is similar, kids have more sensitive hearing (\(0\)–\(15\) dB) compared to adults (\(0\)–\(20\) or \(25\) dB), that needs specialized behavioural or play-based testing. Paediatric audiologists employ play audiometry and behavioural audiometry, which rely on a child's correct response to different sounds. The following audiogram chart examples show different levels of hearing loss in kids. These charts show audiogram results received after a hearing exam.
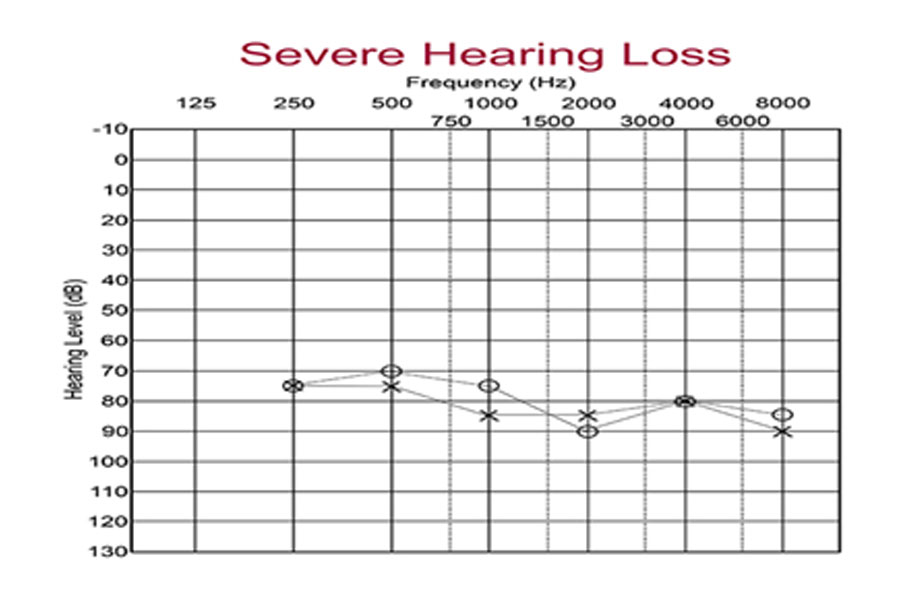
Severe Hearing Loss
Kids with hearing levels in severe range may only hear very loud speech or loud environmental sounds, such as a fire truck siren or a door slamming.
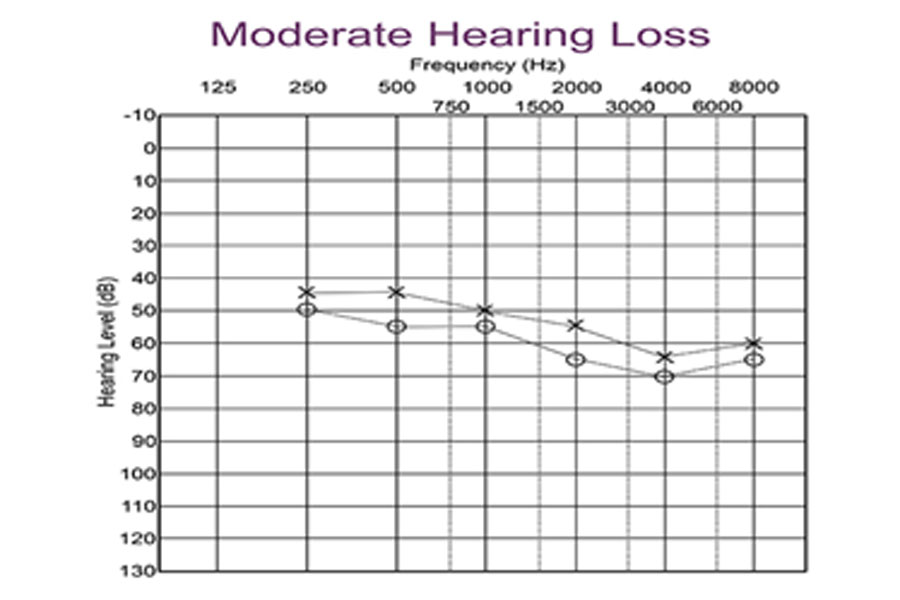
Moderate Hearing Loss
Kids with hearing levels in moderate range will have difficulty hearing regular speech, even at close distances.
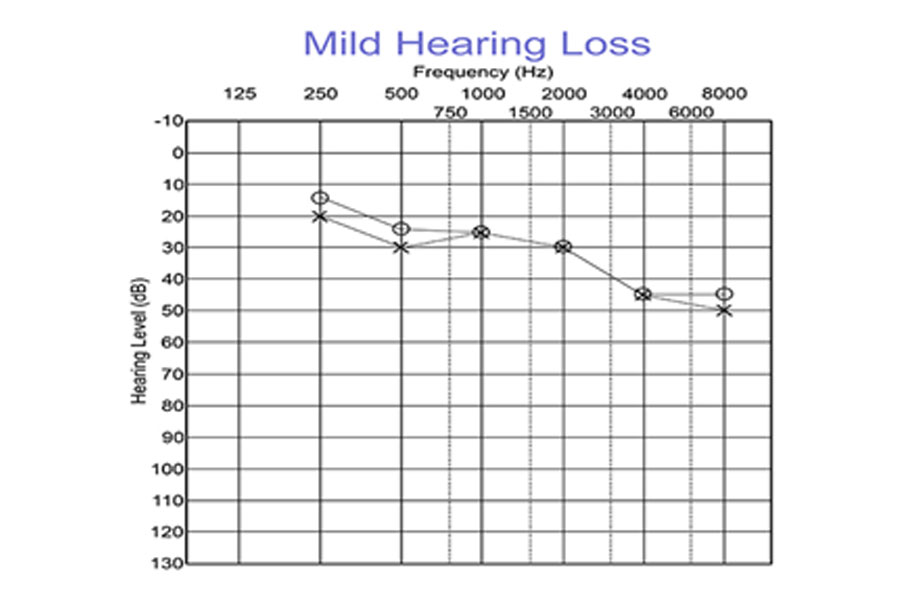
Mild Hearing Loss
Kids with hearing levels in the mild range will have trouble hearing and understanding soft speech, speech from a distance or speech in a background of noise.
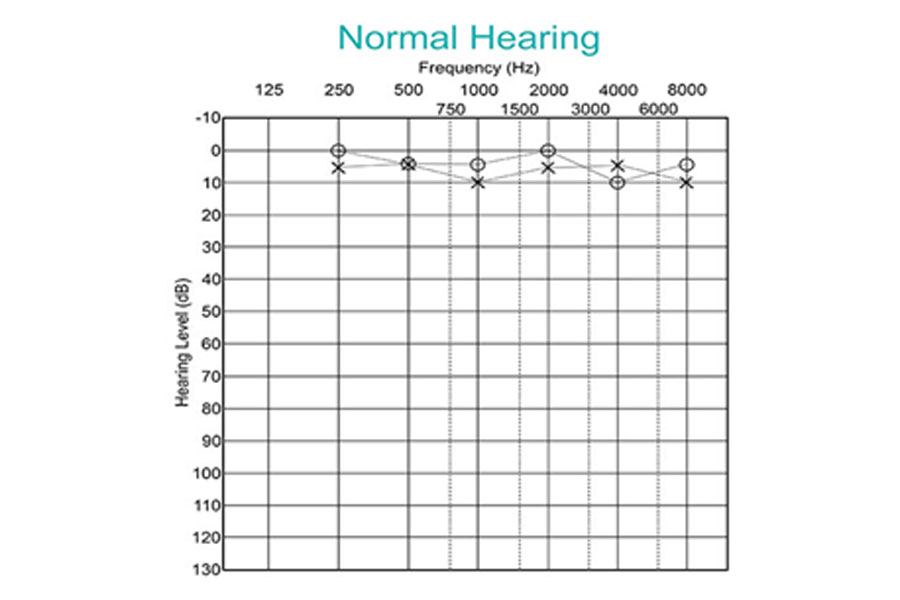
Normal Hearing
This audiogram shows normal hearing.
AudiZone Speech & Hearing Clinic with its pan India presence with 16 branches and a team of highly qualified audiologists can always help you keep your ear safe and healthy whether you are kid or adult.